How to configure Eclipse to debug Alfresco java webscript code
NOTE: It is assumed, that Eclipse environment has been configured to work with Alfresco SDK. If it’s not true the configuration process has been described here: http://wiki.alfresco.com/wiki/Alfresco_SDK_3.4#Set_Eclipse_Compiler_Compliance_Level_to_6.0.
1. Select: Run menu -> Debug configurations…
2. Create new configuration for ‘Remote Java Application’
3. In ‘Project’ field select ‘home’ project (presumably your webscript project), which you want to debug (but it is also possible to debug code from Alfresco core outside selected project)
4. In ‘Connection properties’ set Tomcat server IP address and debug port you defined earlier.
NOTE: It’s advised against to use ‘localhost’ instead of IP address on Windows because of hosts file issues.
5. Click Apply, Debug
6. If everything went correct you shouldn’t get any message.
7. Switch to debug perspective
8. You should see something like this:
In case of debug session disconnection (eg. Tomcat restart) you may reconnect to it using Relaunch option:
9. Now you can normally set breakpoints and trace code execution of your webscript or other Alfresco SDK projects. A good test is setting a breakpoint in org.alfresco.web.bean.LoginBean at line
“FacesContext context = FacesContext.getCurrentInstance();” – breakpoint should be caught at Alfresco Explorer login attemp.
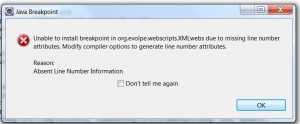
NOTE: You may get following error message: “Unable to install breakpoint in org.evolpe.webscripts.XMLwebs due to missing line number attributes. Modify compiler options to generate line number attributes.
Reason:
Absent Line Number Information”
CAUSE&SOLUTION: To debug your own webscripts or other code it’s essential to enable code line number information in the compiler. If you use ant, set debug=”true’ parameter in javac task.
How to configure tomcat to debug instance of Alfresco on Windows and Linux will be described soon in my next articles.;)


